Monitoring
Monitoring is done using the standard Grafana software. The dashboards below are pre-configured.
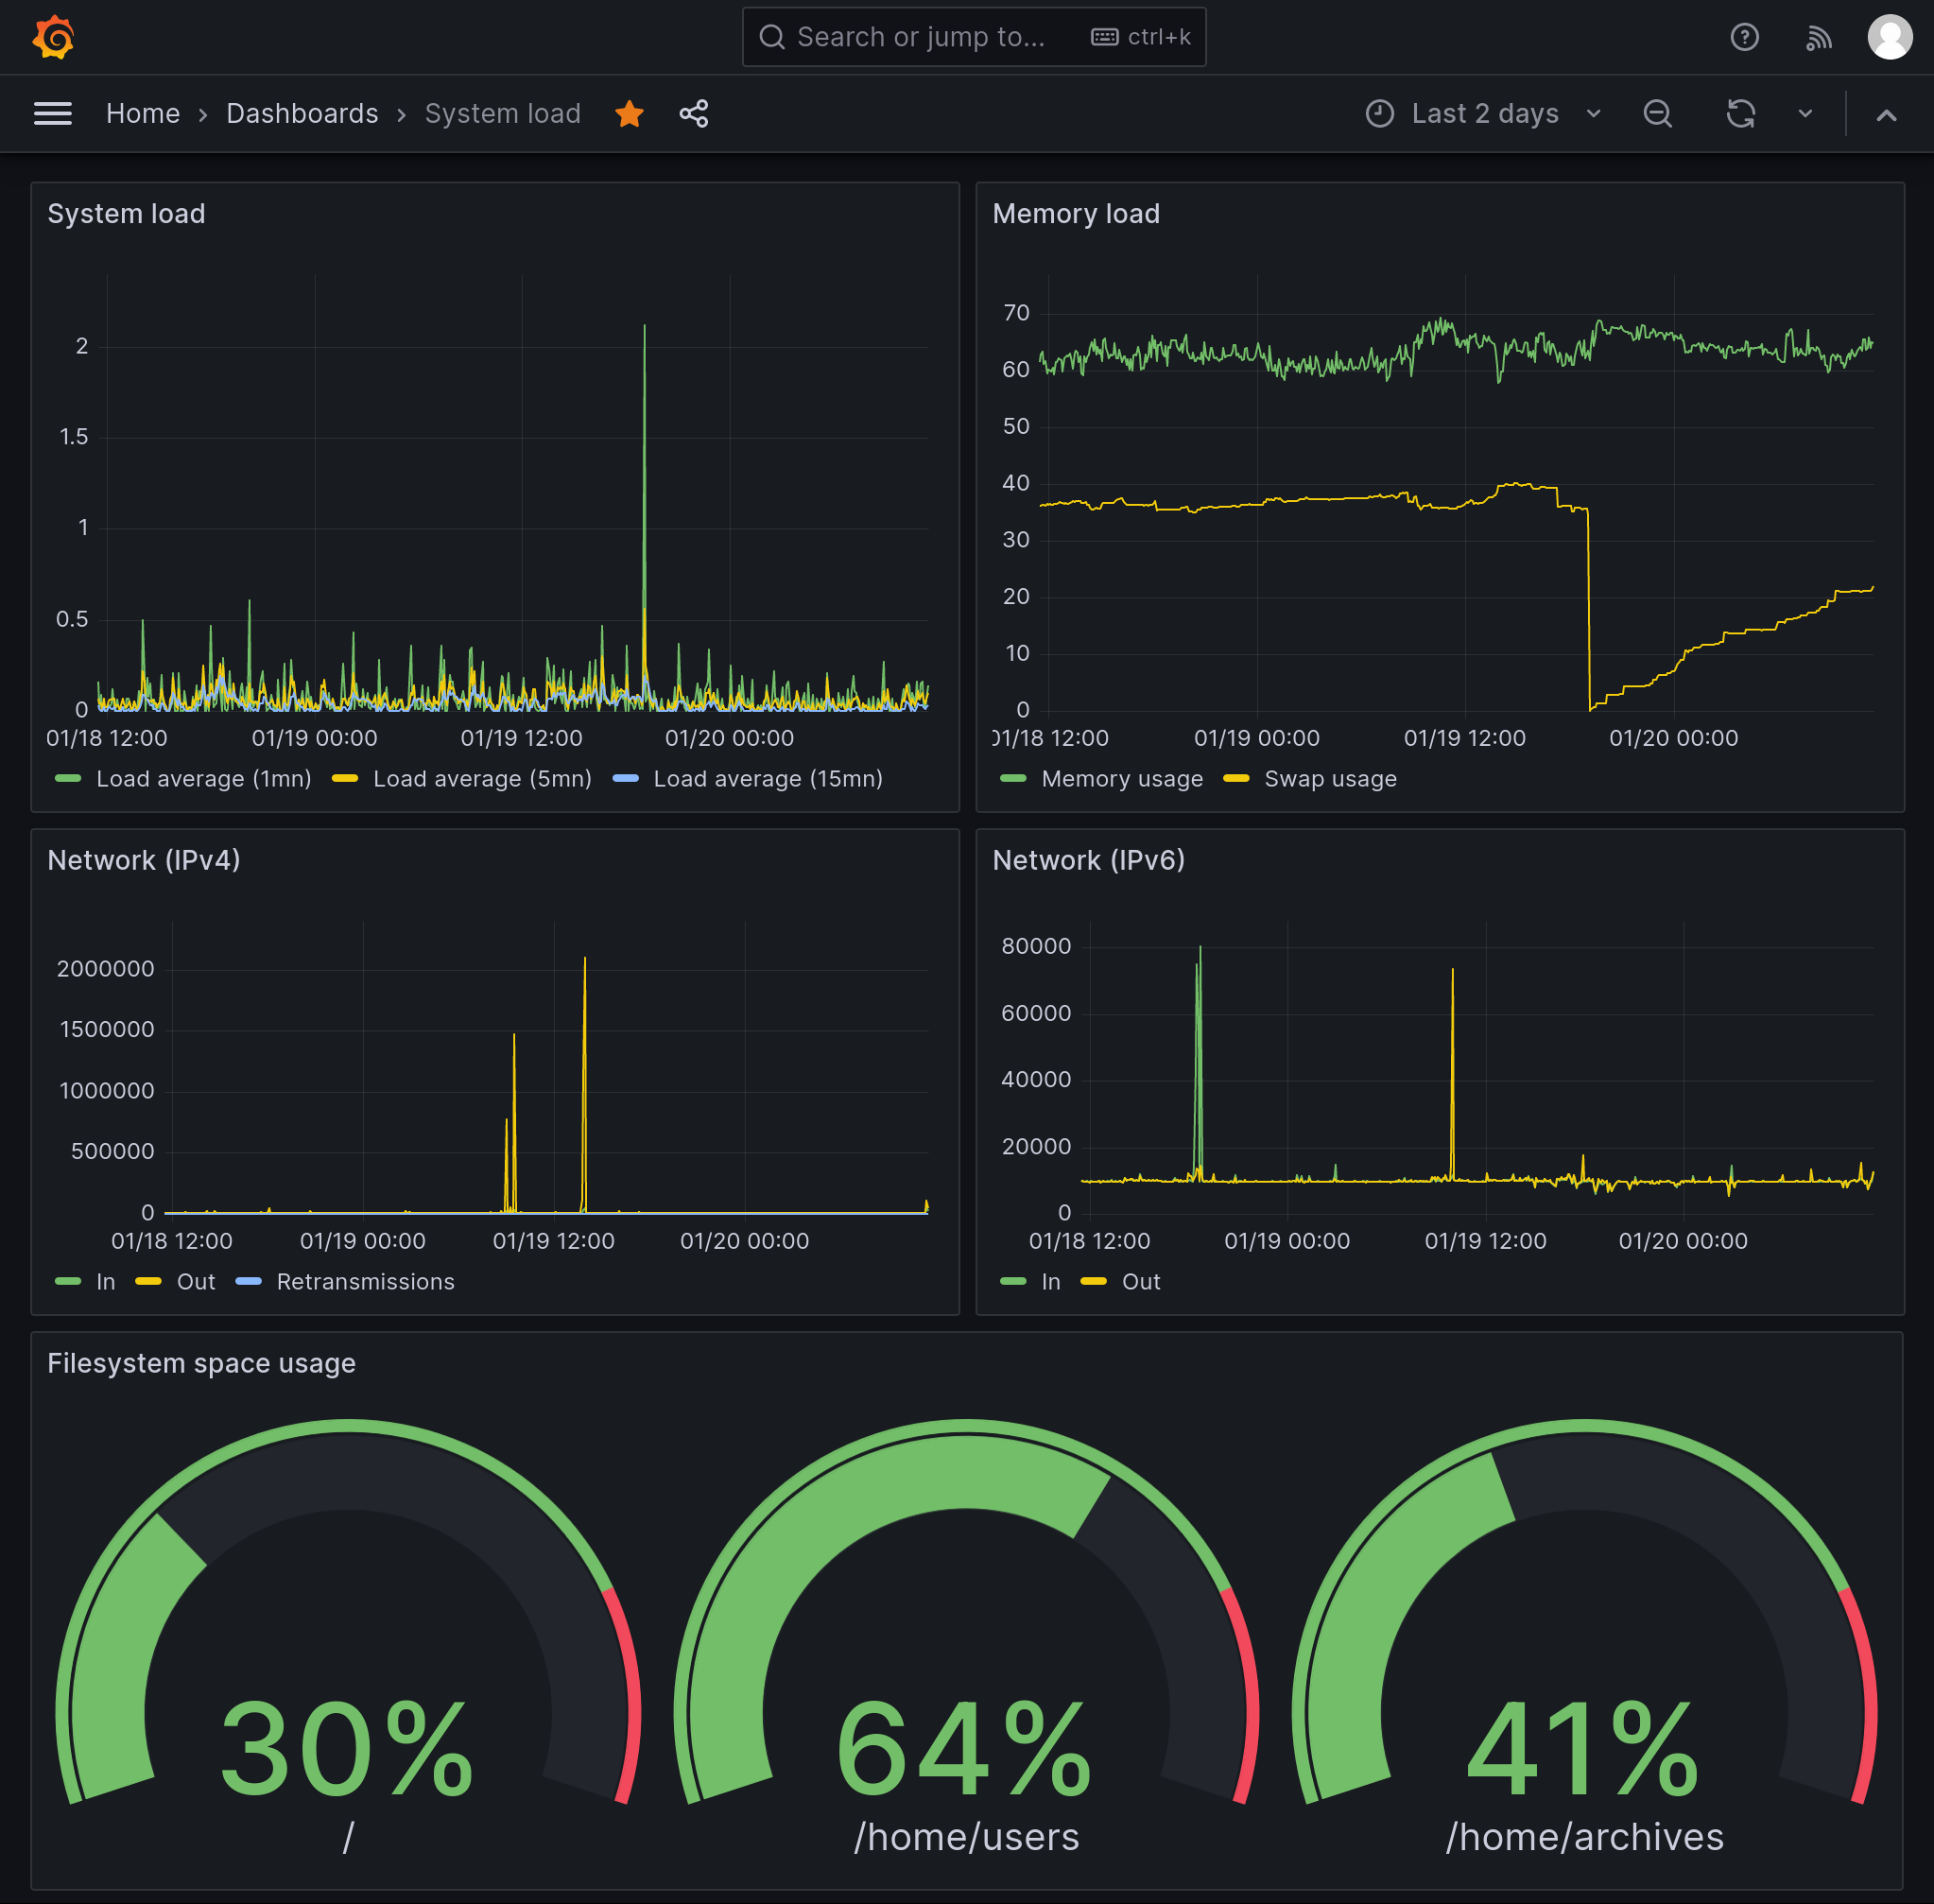
System load

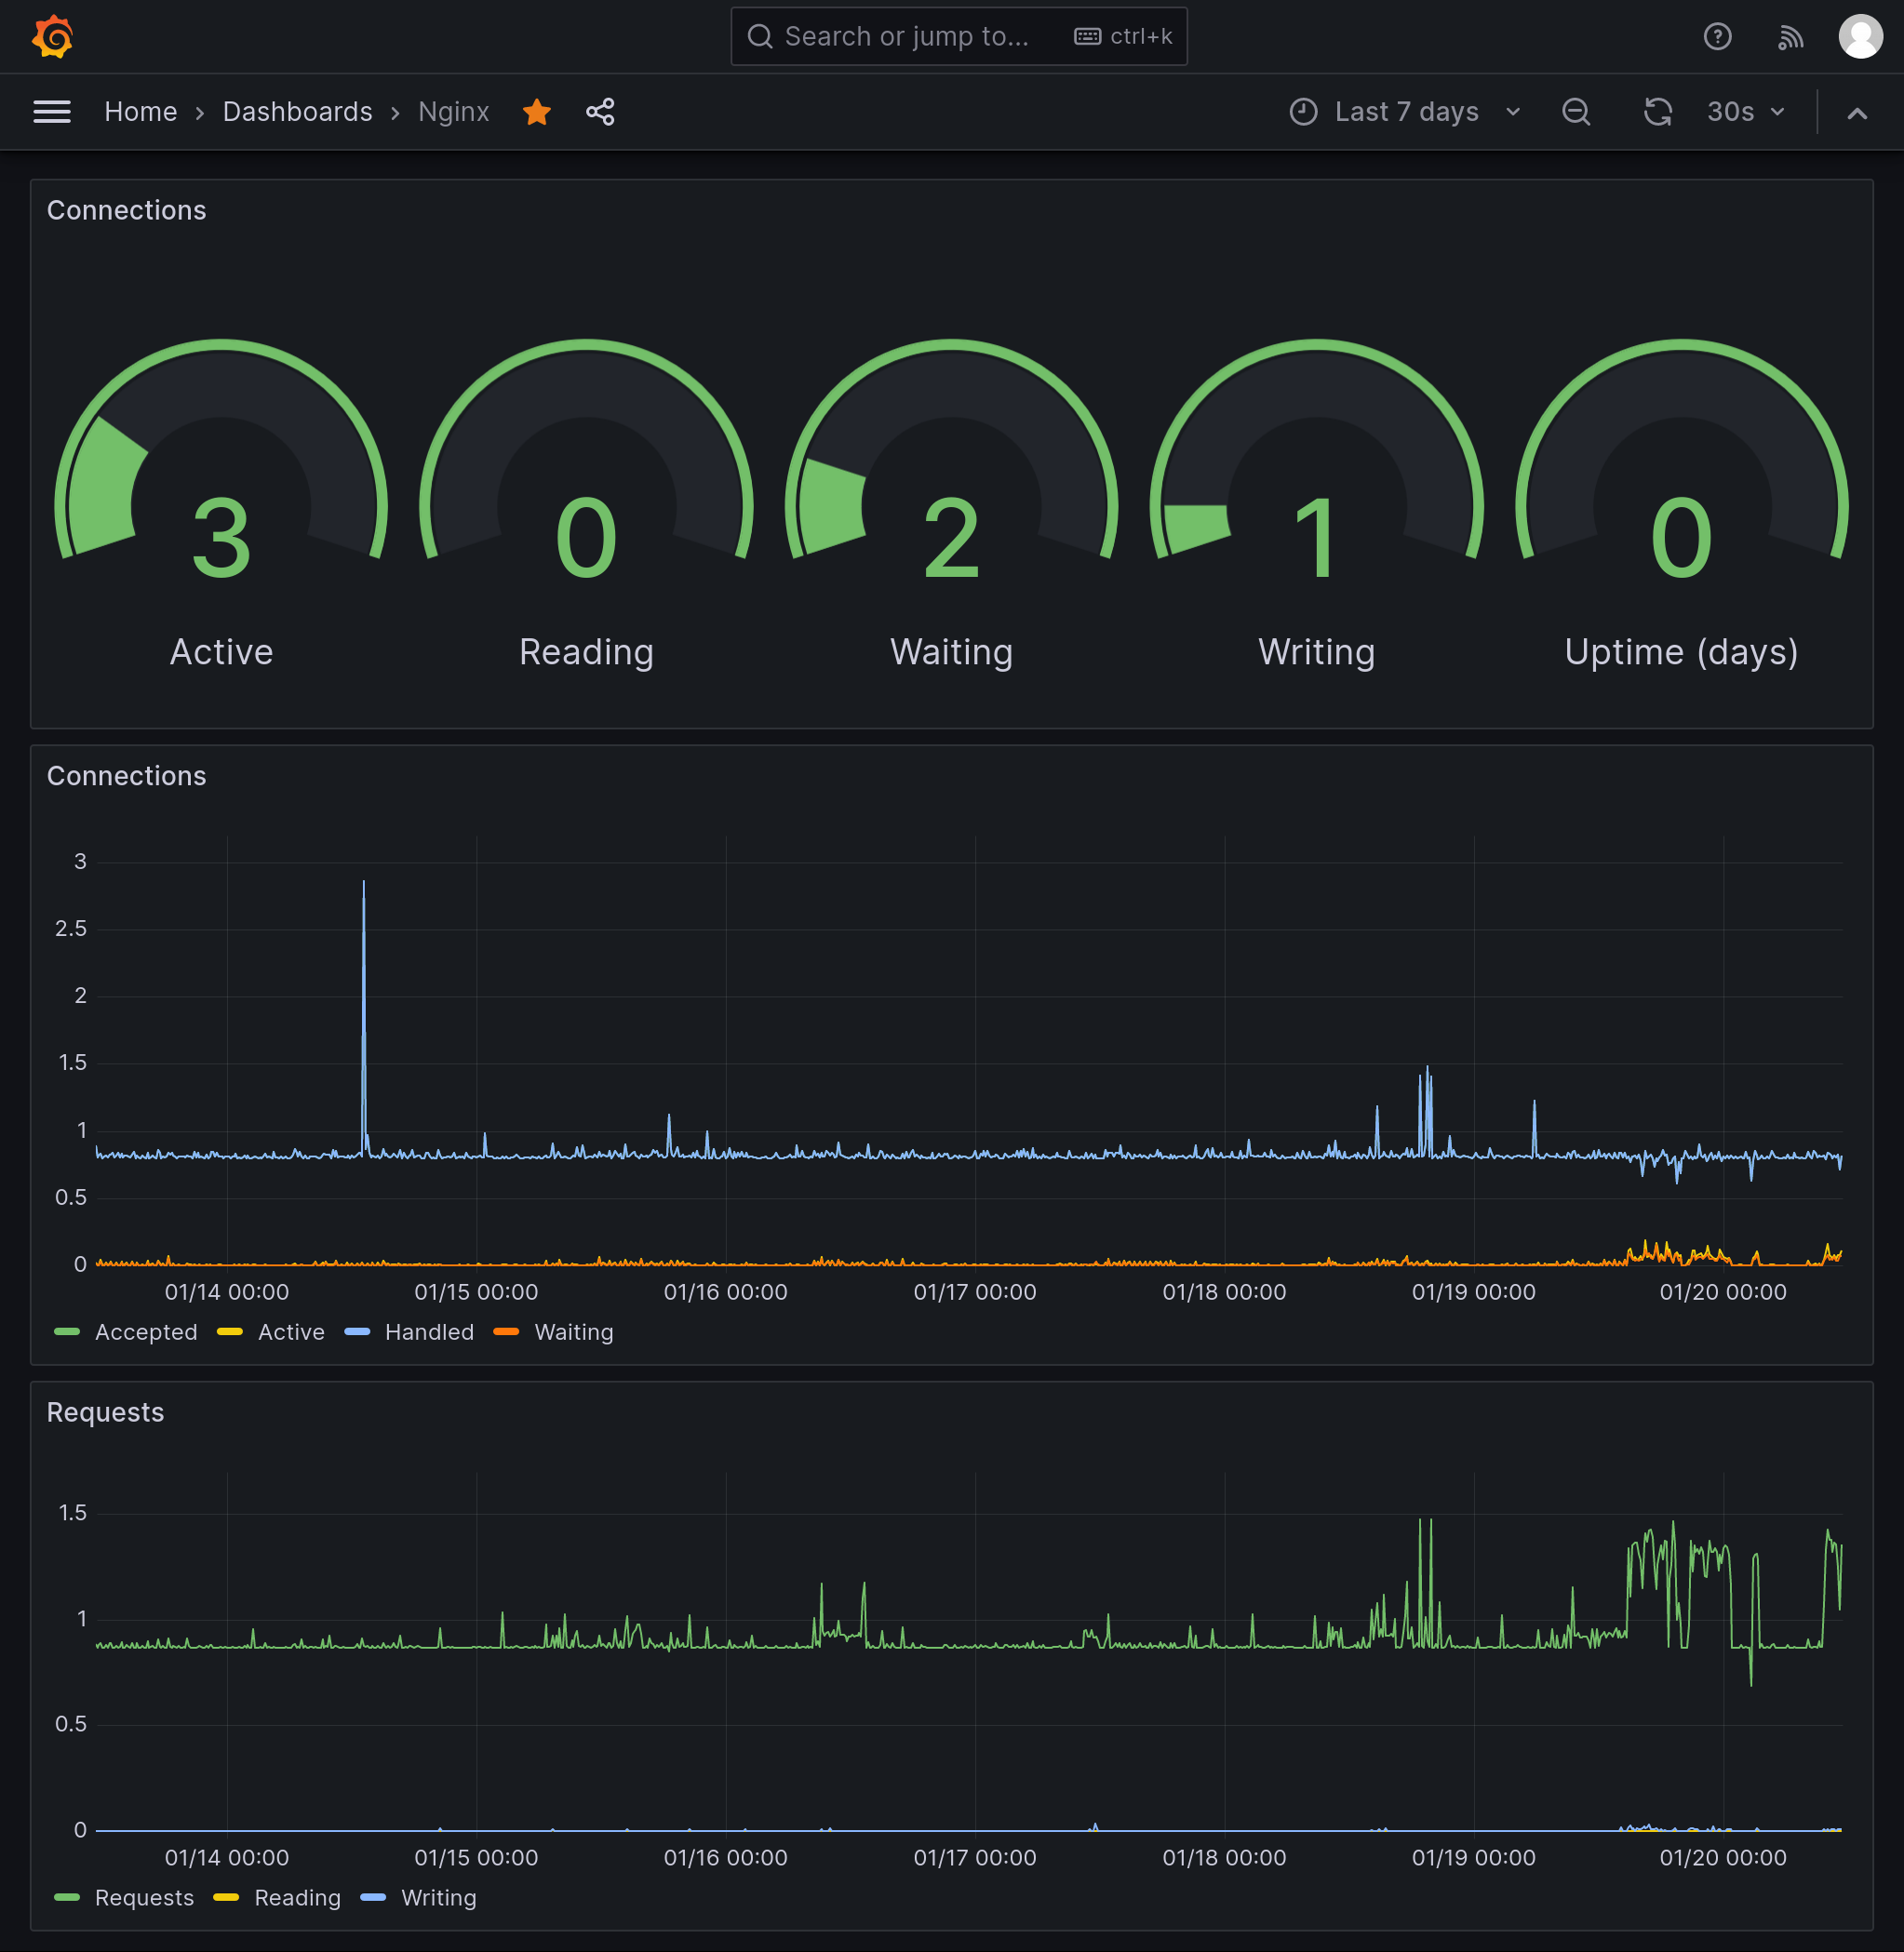
Nginx

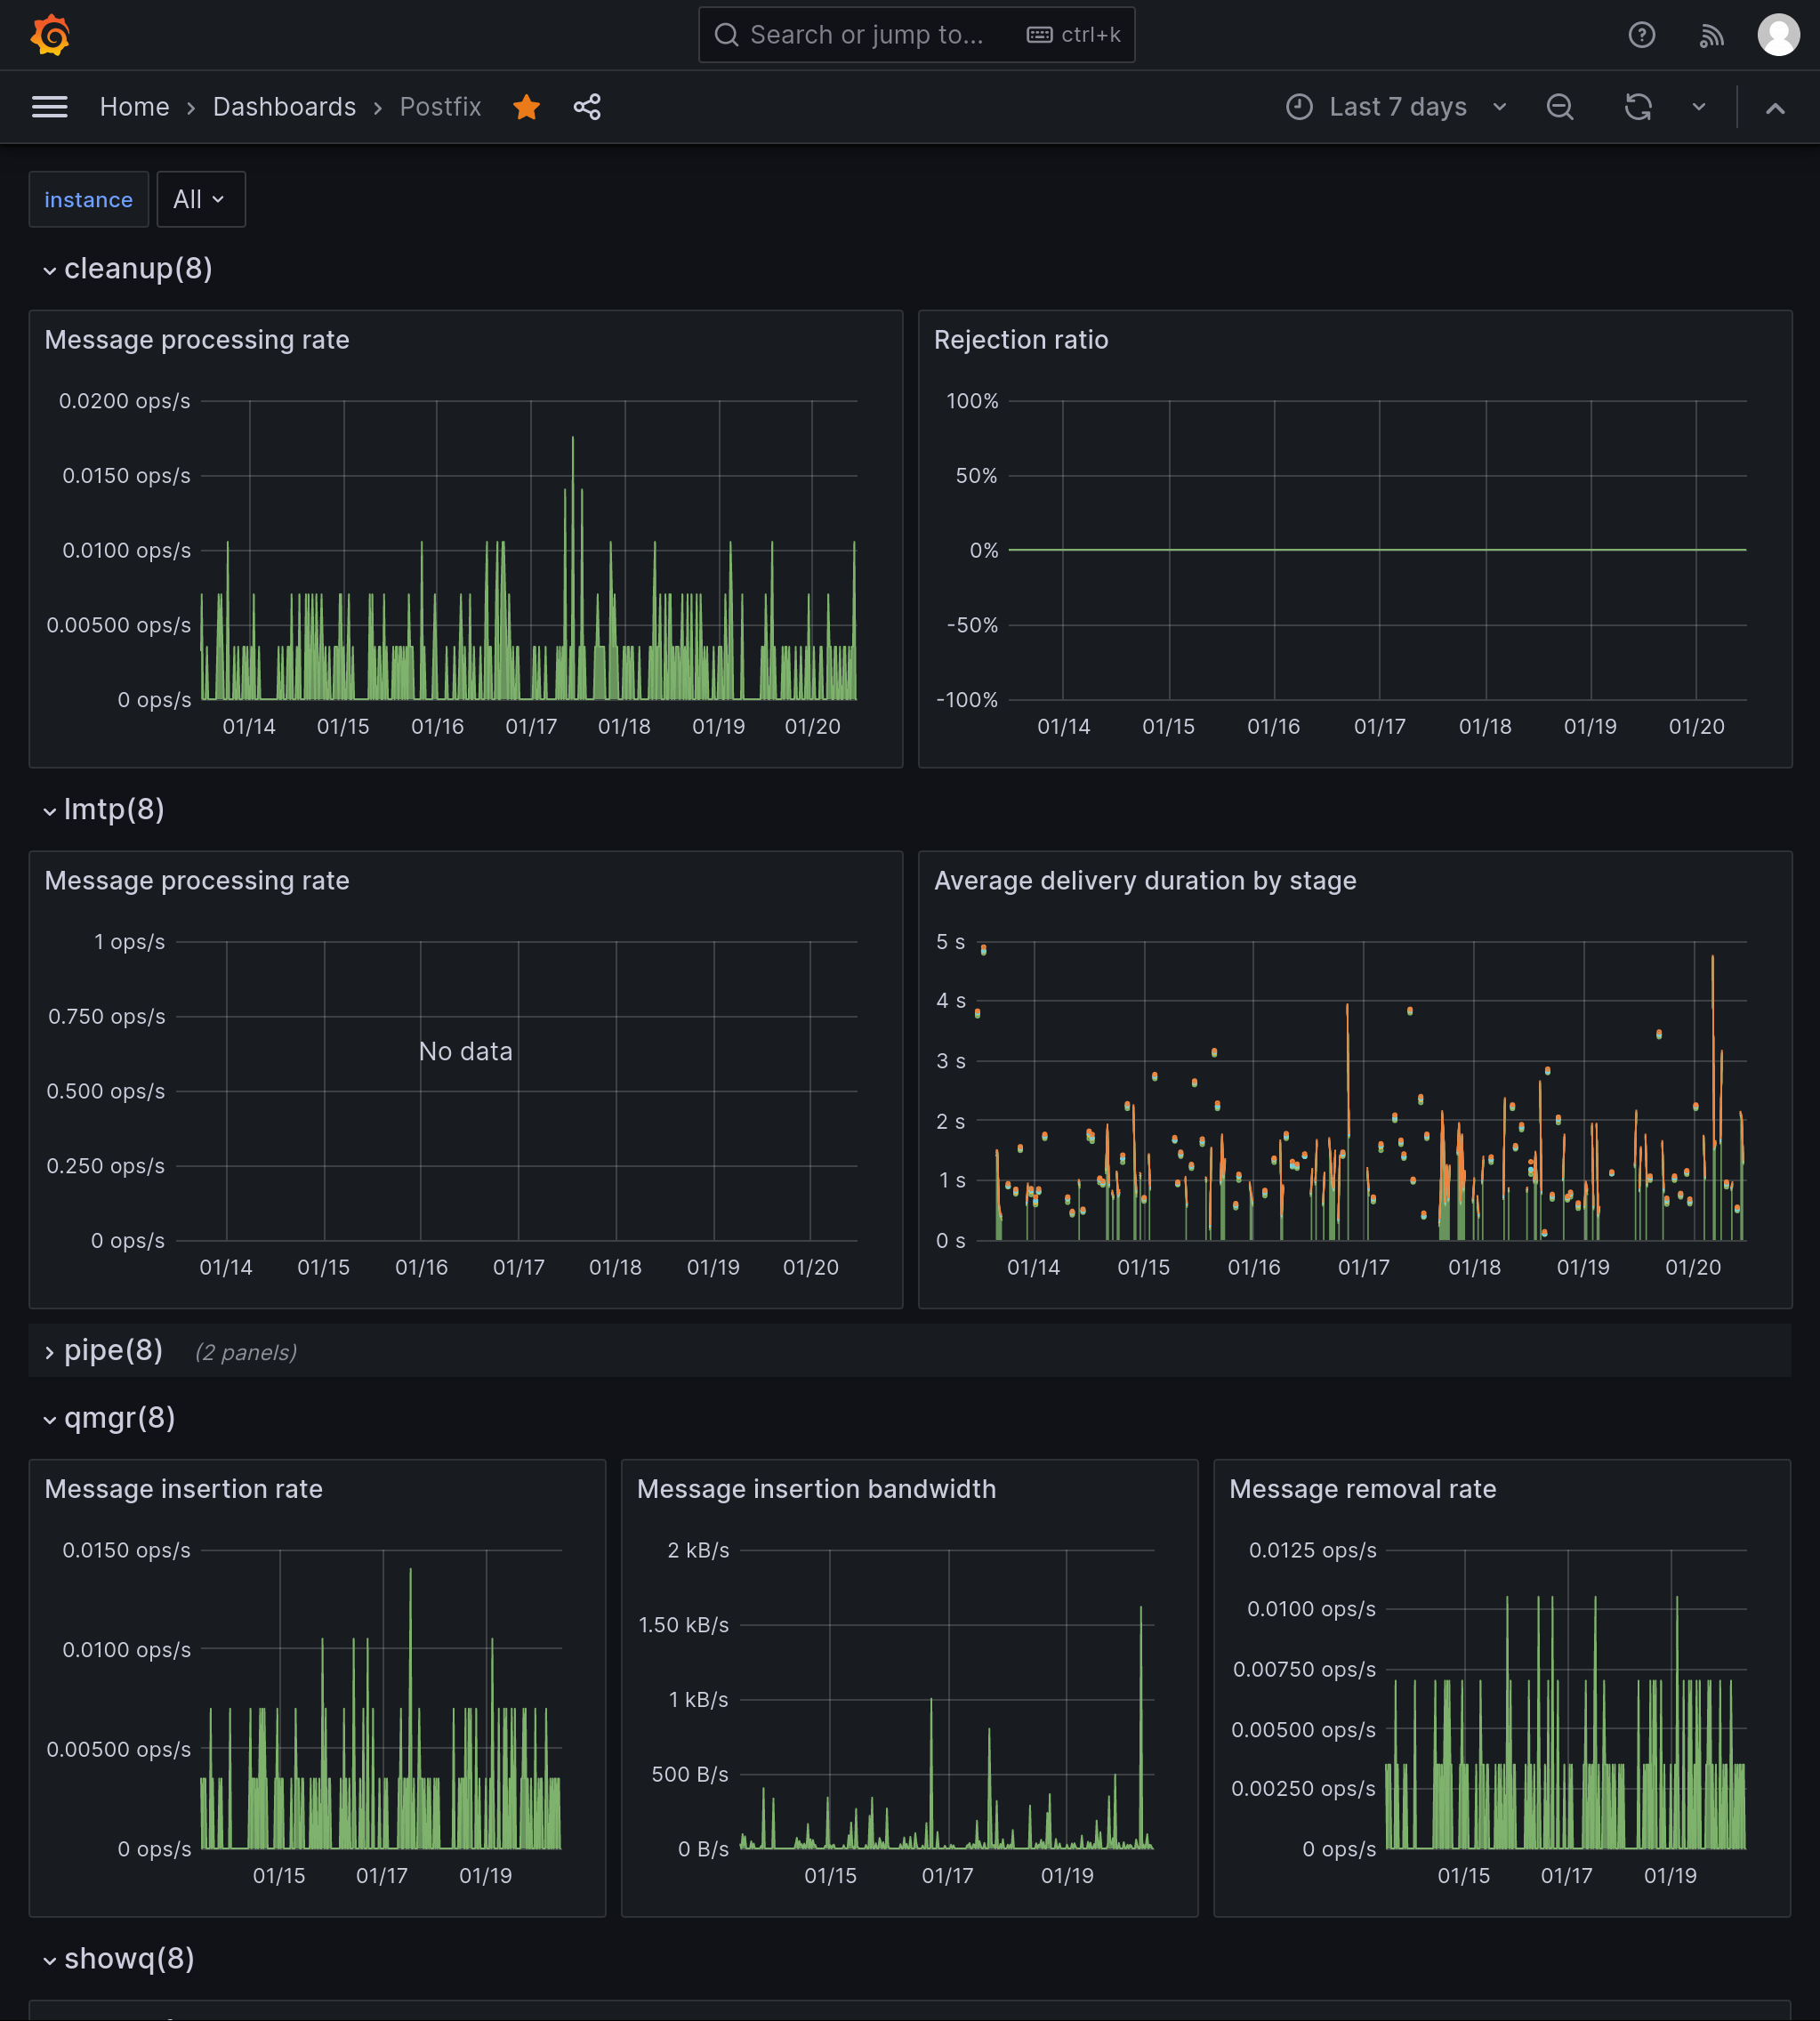
Postfix

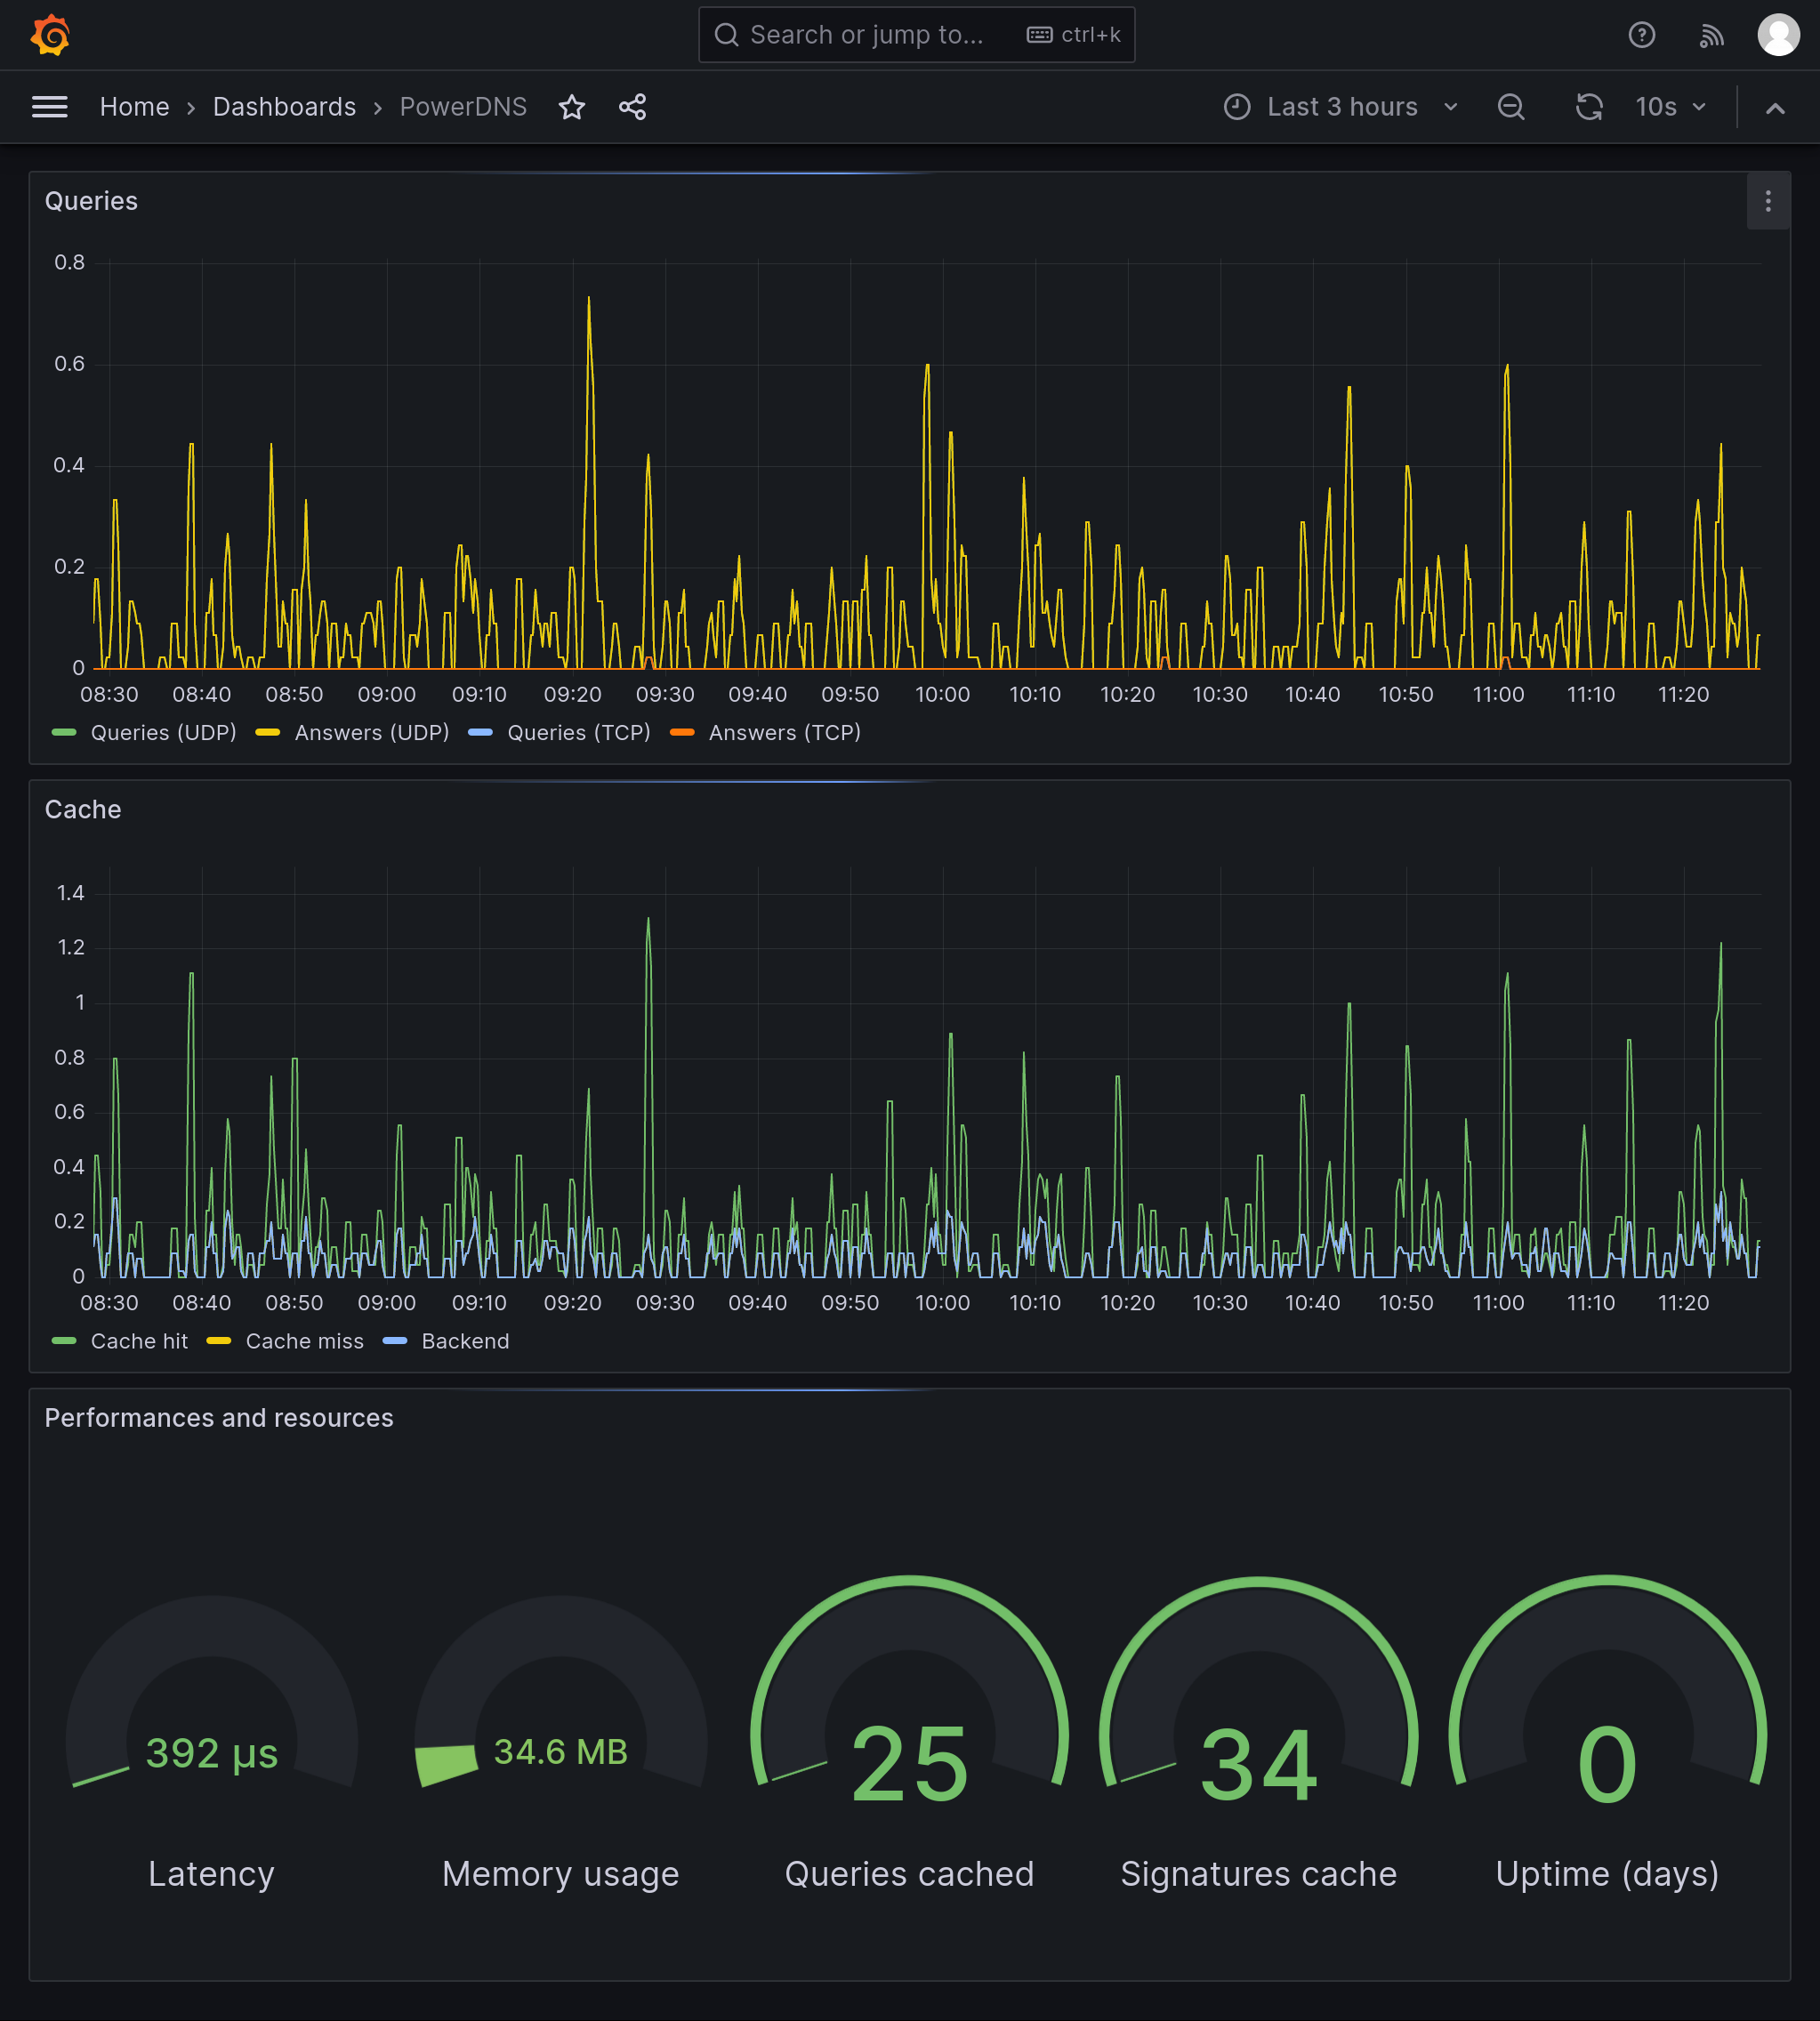
PowerDNS
